Open:
High:
Low:
Close:
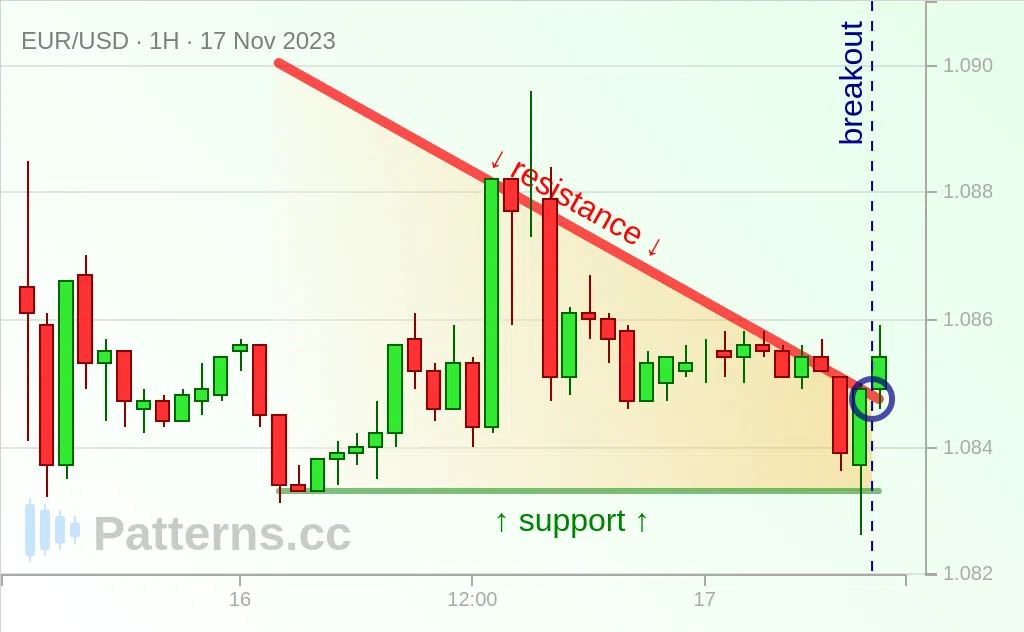
 EUR/USD: مثلث هابط
EUR/USD,
1 ساعة
شراء
نوفمبر 17
As we can see a descending triangle occurs and the price breaks out.
A descending triangle can be thought of as a technical bullish chart indicator that often spots the bears have run out of steam once price breaks through the resistance.
A bullish move towards the 1.086 zone is possible.