Open:
High:
Low:
Close:
 AUD/USD: المثلث المتماثل
AUD/USD,
1 ساعة
شراء
يونيو 30
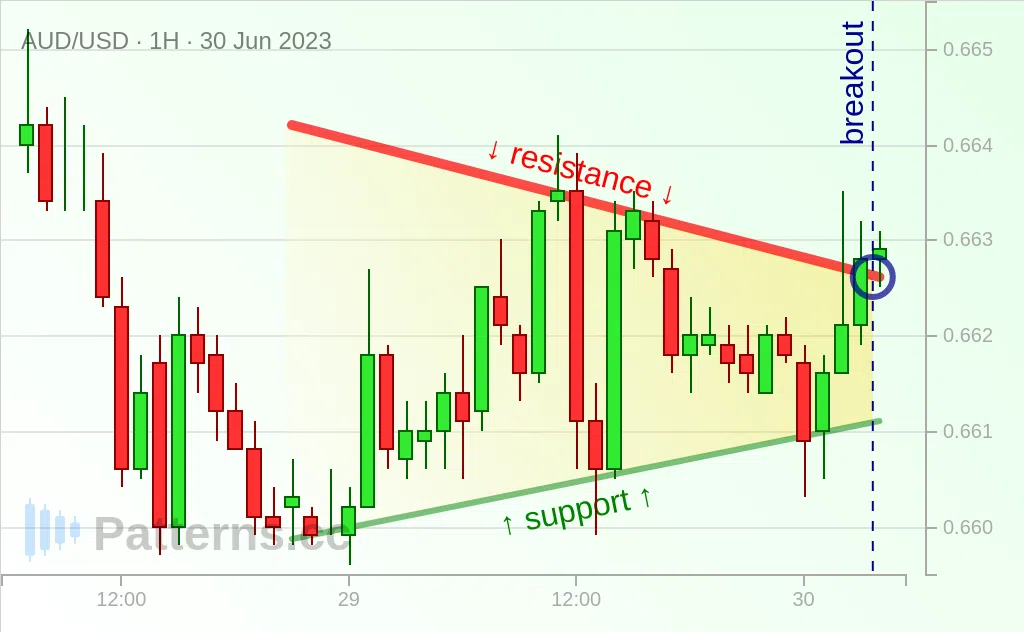
It seems like the price develops a symmetrical triangle.
A symmetrical triangle is believed to be a specific chart indicator that is used to signal that prices are likely to keep rallying upward once price breaks through the resistance.
It is not ruled out that a bullish move towards the 0.664 mark will happen once beyond 0.6628 as the currency pair challenges 0.6628 hurdle.