Open:
High:
Low:
Close:
 بيتكوين كاش: مستطيل
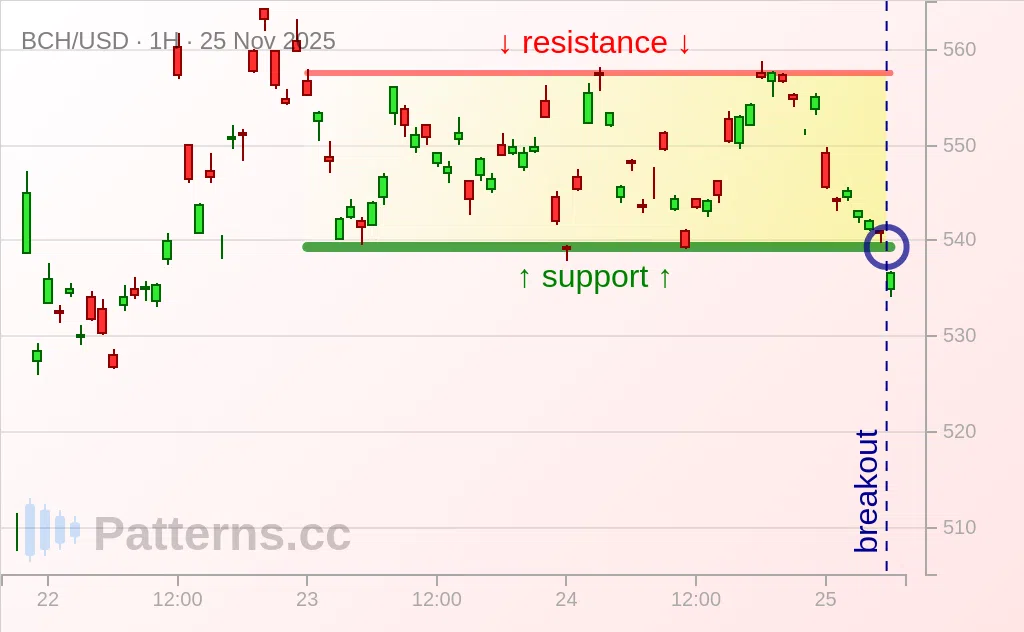
BCH/USD,
1 ساعة
بيع
نوفمبر 25
We can see that a rectangle is close to being complete and the price requires a next bigger correction as an information of a breakout.
A rectangle is said to depict a reliable signal that can be used to predict extending an downtrend when price breakdown occurs.
It is possible that a bearish continuation towards the 535 level will occur once below 538 as bears looking for profit.