Open:
High:
Low:
Close:
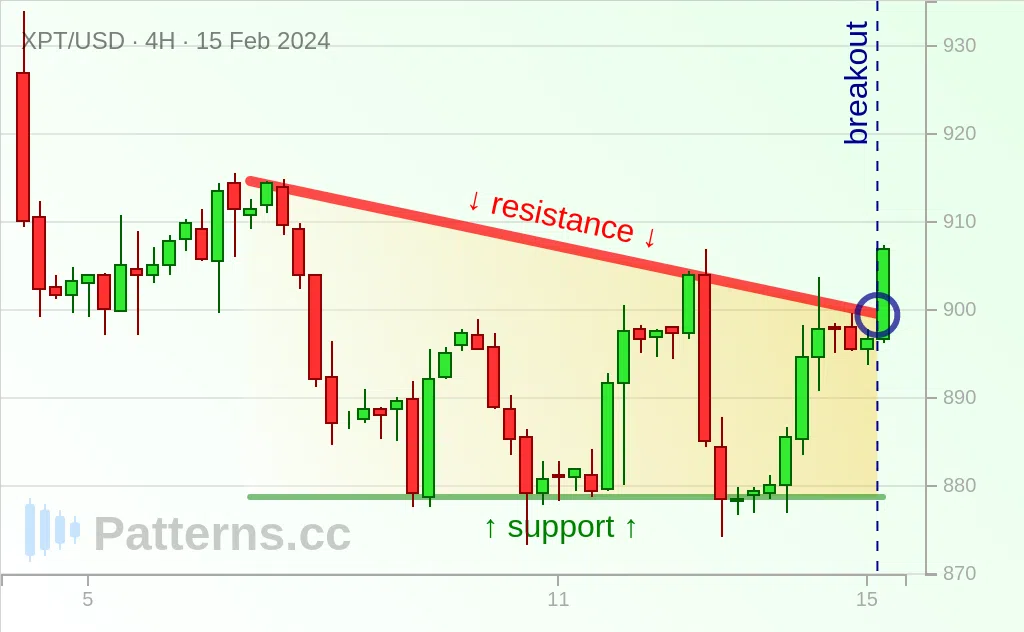
 Platinum: 下降三角形型
XPT/USD,
4 時間
ロング
2月 15
We can see that a descending triangle is identified.
A descending triangle identifies a technical chart pattern that can be used to indicate that prices are likely to keep rallying upward in case if price breaks through the resistance.
XPT/USD to increase bullish potential to the 910 mark on a breakout of the descending triangle.