Open:
High:
Low:
Close:
 EUR/USD: 矩形
EUR/USD,
1 小时
做多
十二月 4
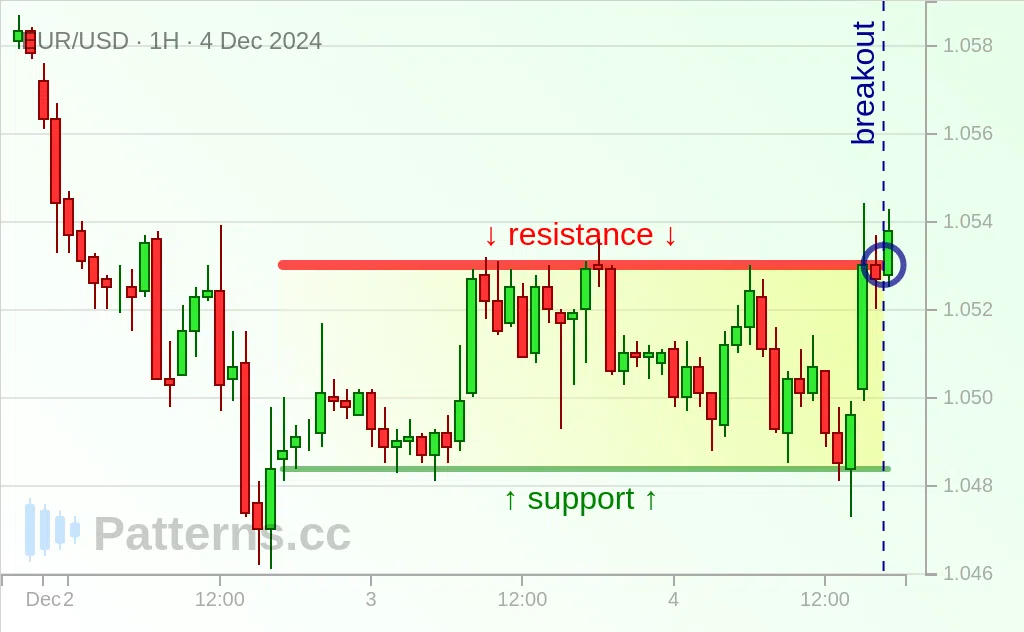
We can see that a rectangle appears, the price is going to break out.
A rectangle can be thought of as a reliable bullish price action indicator that is used to predict that the price will rally further if price breaks out to the the upside.
There is a possibility of a further bullish continuation to the 1.056 mark.