看涨矩形
 USD/JPY
1H
USD/JPY
1H
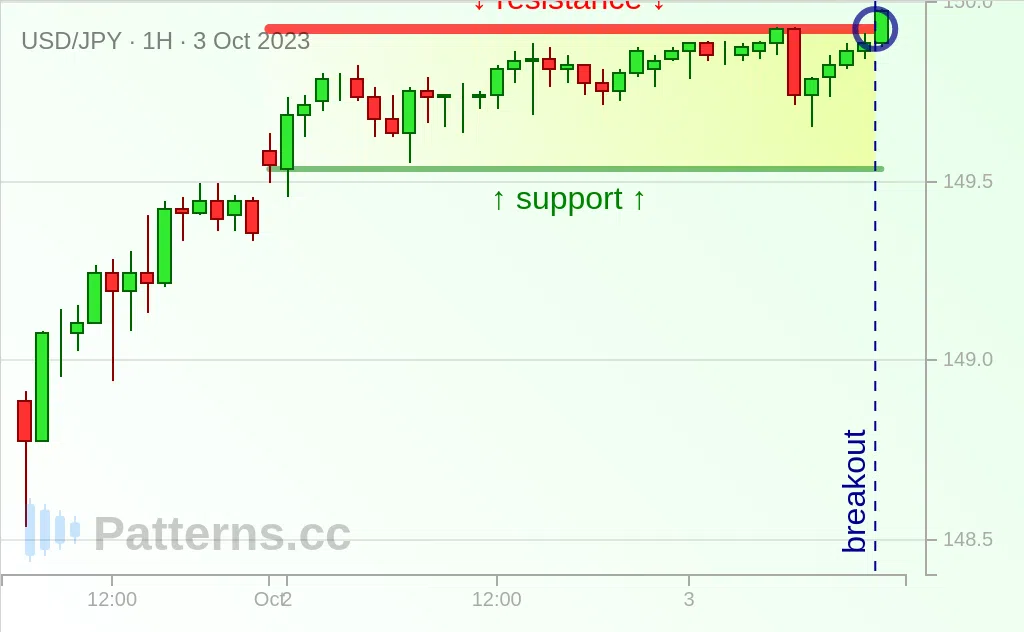
A bullish rectangle appears, the price is about to break out soon.
A bullish rectangle tends to be a chart pattern that identifies extending an uptrend once price breaks out to the the upside.
A rangebound towards 150 is a possibility as weakness seen overdone.