对称三角形
 Platinum
XPT/USD
1H
Platinum
XPT/USD
1H
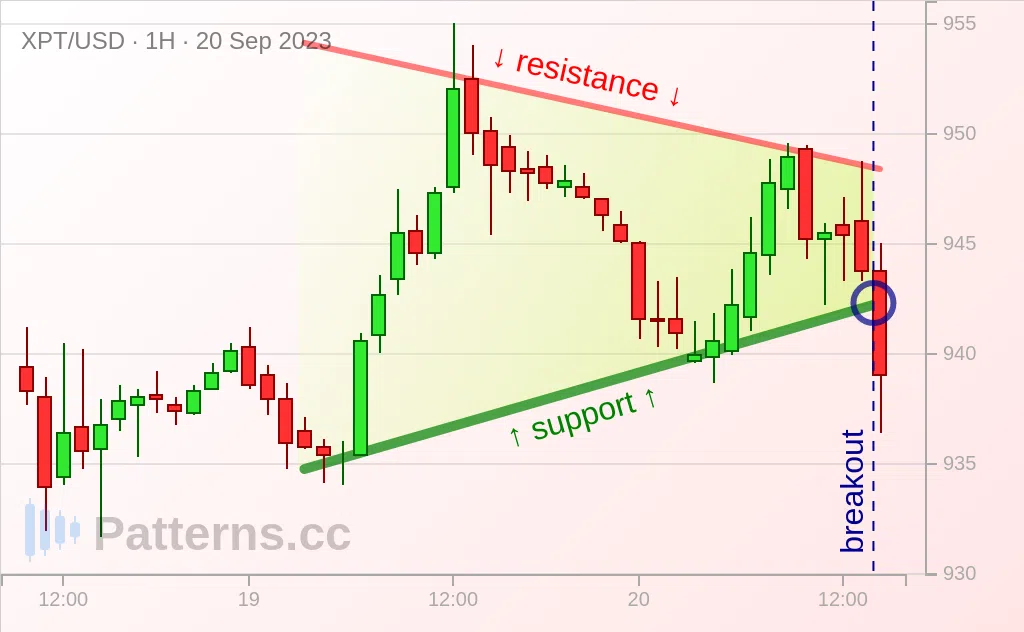
There is a symmetrical triangle turning up and XPT/USD asks for a next move as an information of a breakdown.
A symmetrical triangle is considered to be a technical bearish chart indicator that results in that the price to go short if price breaks out to the the downside.
It is possible that a move to 935 will form as XPT/USD probes 941 hurdle.