Open:
High:
Low:
Close:

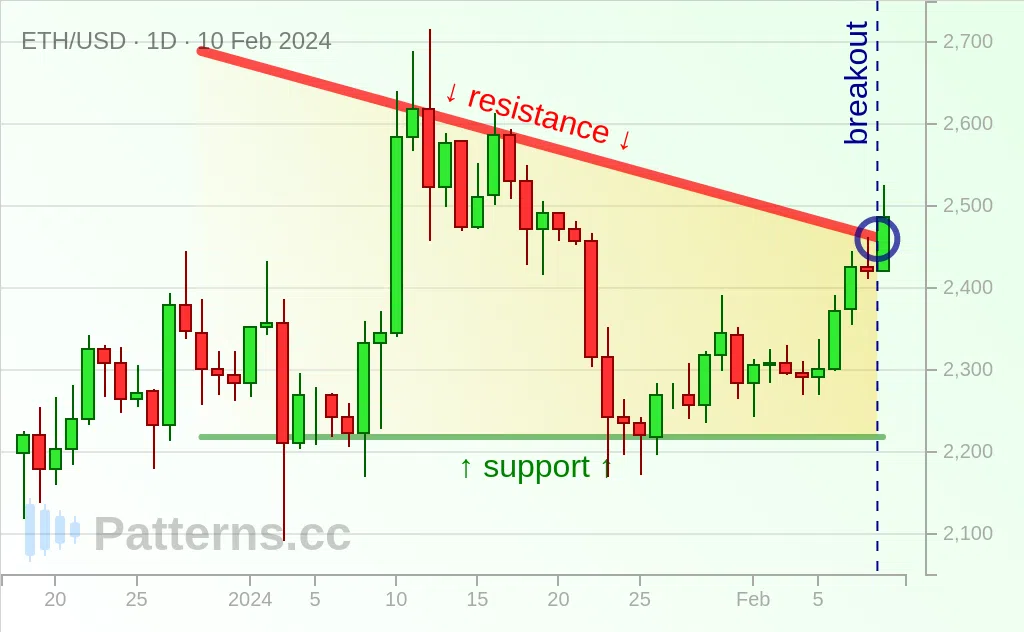
Ethereum: Descending Triangle

ETH/USD, 1 day    LONG Feb 10
A descending triangle has been detected, ETH/USD requests a next bigger impulse up as an information of a breakout. A descending triangle can be thought of as a technical chart pattern that can be used to signal a move up once price breaks above resistance. ETH/USD to enjoy a considerable gain to 2600 on a breakout of the descending triangle as ETH/USD challenges 2480 hurdle.
Disclaimer. No Investment Advice Provided. Any opinions, chats, messages, news, research, analyses, prices, or other information contained on this Website are provided as general market information for educational and entertainment purposes only, and do not constitute investment advice. The data and prices on the website are not necessarily provided by any market or exchange, but may be provided by market makers, and so prices may not be accurate and may differ from the actual price at any given market, meaning prices are indicative and not appropriate for trading purposes. Patterns.cc will not accept liability for any loss or damage, including without limitation any loss of profit, which may arise directly or indirectly from use of or reliance on such information. Risk Disclosure. Trading in financial instruments and/or cryptocurrencies involves high risks including the risk of losing some, or all, of your investment amount, and may not be suitable for all investors. Before deciding to trade in financial instrument or cryptocurrencies you should be fully informed of the risks and costs associated with trading the financial markets, carefully consider your investment objectives, level of experience, and risk appetite, and seek professional advice where needed.