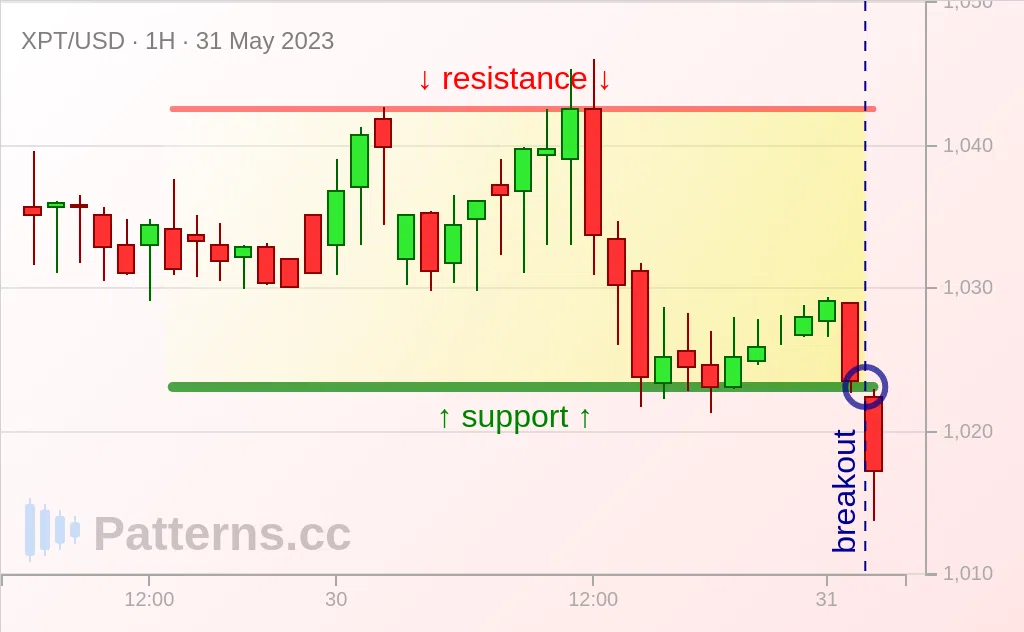
XPT/USD establishes a rectangle, XPT/USD calls for a next active move for the certainty of breakdown.
A rectangle is considered to be a compelling bearish chart formation that is used to indicate prices are likely to keep falling downward once price breakdown occurs.
There is a probability of a bearish push down to the 1020 level once below 1022.
Disclaimer.
No Investment Advice Provided.
Any opinions, chats, messages, news, research, analyses, prices, or other information contained on this Website are provided as general market information for educational and entertainment purposes only, and do not constitute investment advice.
The data and prices on the website are not necessarily provided by any market or exchange, but may be provided by market makers, and so prices may not be accurate and may differ from the actual price at any given market, meaning prices are indicative and not appropriate for trading purposes.
Patterns.cc will not accept liability for any loss or damage, including without limitation any loss of profit, which may arise directly or indirectly from use of or reliance on such information.
Risk Disclosure.
Trading in financial instruments and/or cryptocurrencies involves high risks including the risk of losing some, or all, of your investment amount, and may not be suitable for all investors.
Before deciding to trade in financial instrument or cryptocurrencies you should be fully informed of the risks and costs associated with trading the financial markets, carefully consider your investment objectives, level of experience, and risk appetite, and seek professional advice where needed.
 Platinum: Rectangle